Trends in Luxury Handbags 2026
The Purpose
Luxury handbag market reports help people researching the luxury handbag market ( consumers, resale sellers, investors, or students of the fashion/business industry) find and interpret market data, company financial disclosures, and resale-price data so they can draw their own informed conclusions about where the market is heading, which brands are strongest, and whether specific handbags function as good "investments."
Some Examples
1. Future Market Insights (Market Research / Forecast Data)
Full market-sizing report: The following full market-sizing report includes components like 2026 market value, 2036 forecast, CAGR, segment breakdowns (product type, material, end user, distribution channel), country-by-country growth table, competitive benchmarking table, and key company profiles.
Image 1a - FMI Market Size & CAGR Forecast (bar + line chart, 2025-2036)
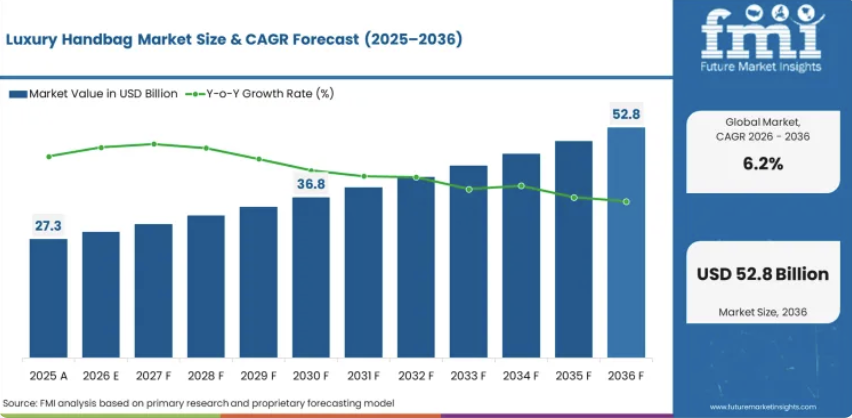
Image 1b - Top Country Growth Comparison (indexed line chart)
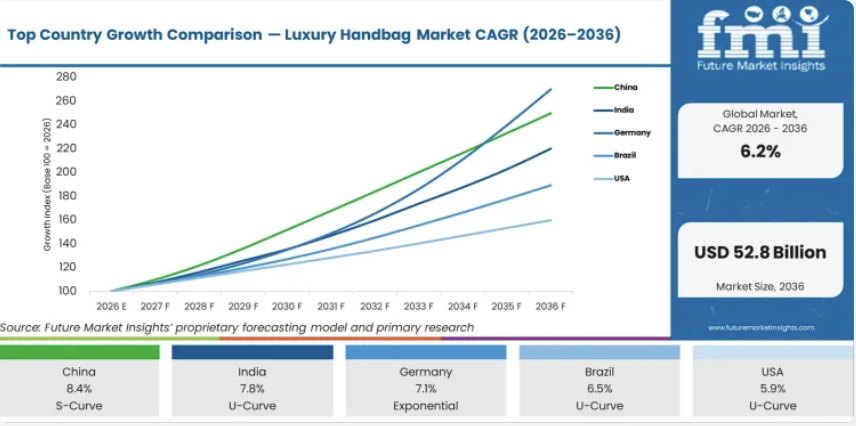
Image 1c - Top Country Growth Comparison (horizontal bar chart by CAGR)
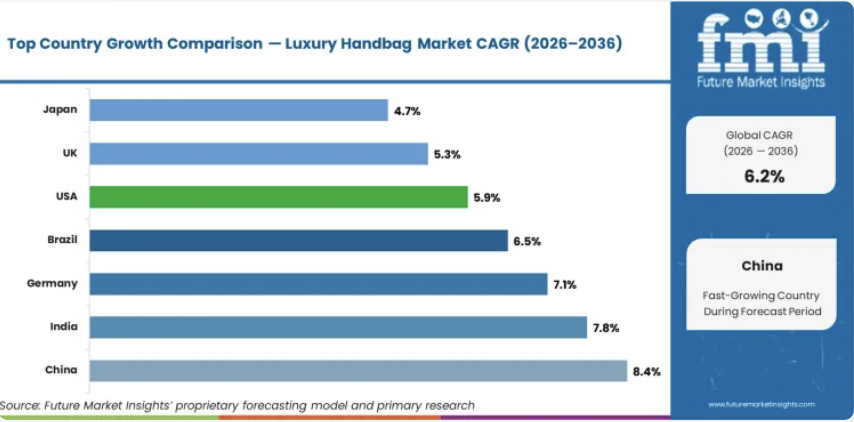
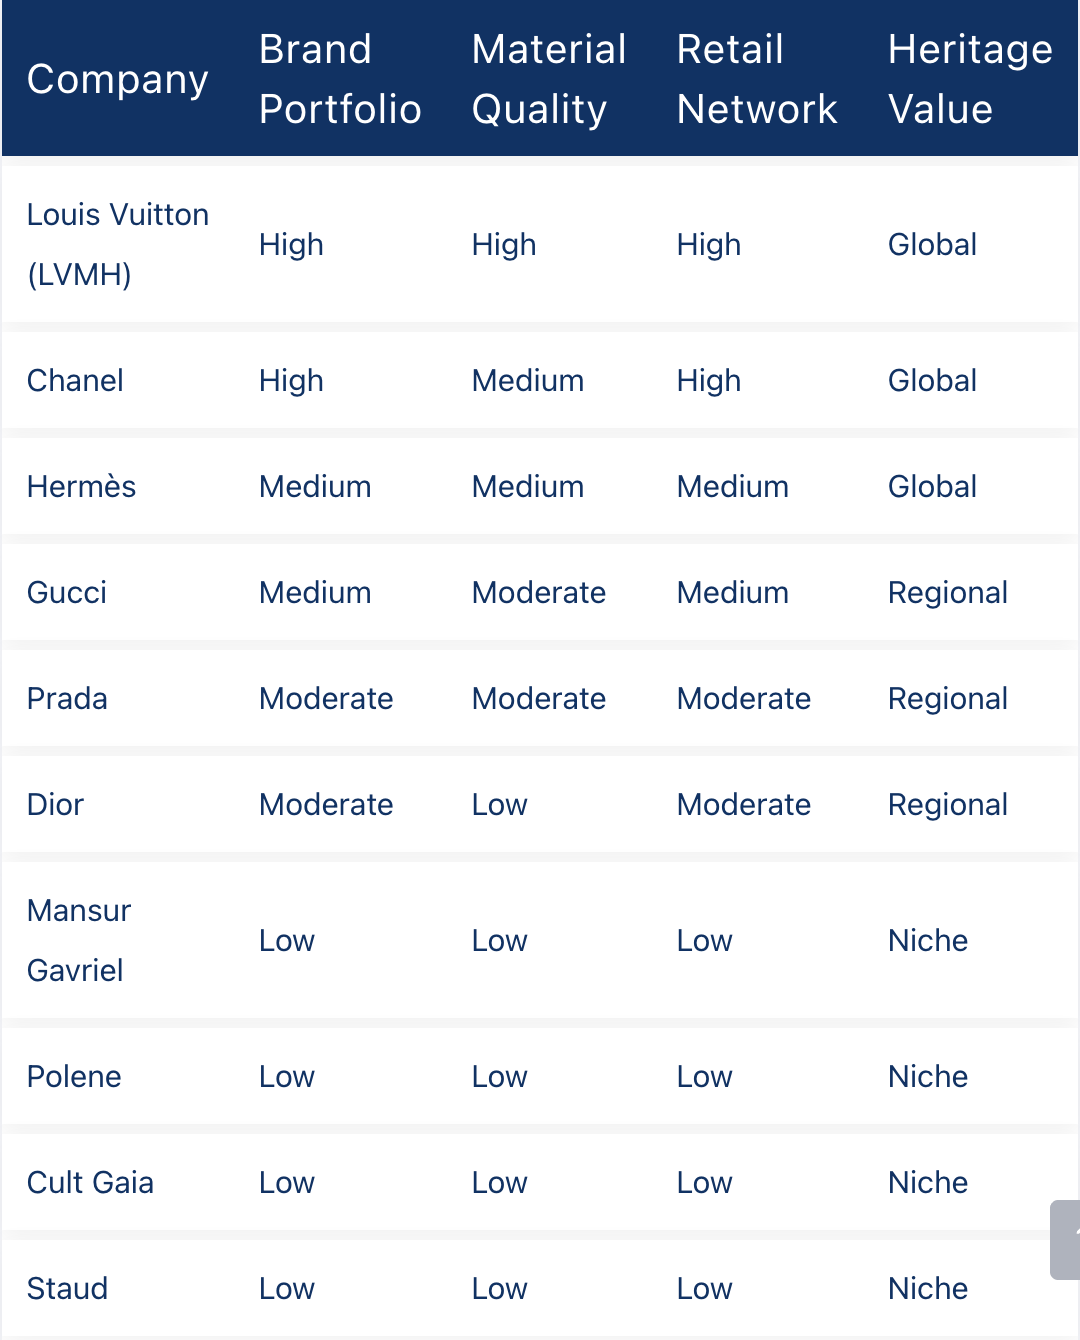
Image 2 - Competitive Benchmarking Table (Company Comparison)
2. Statista (Aggregated Public Statistics)
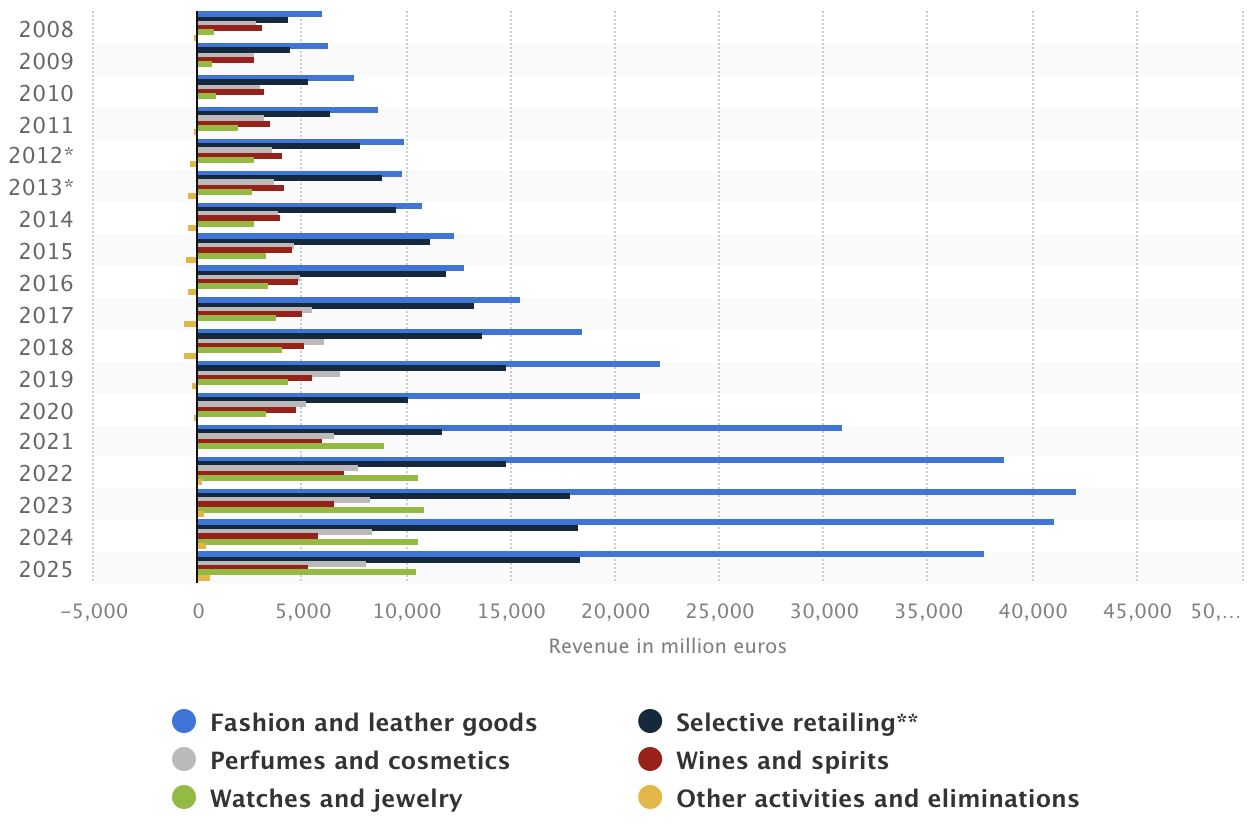
"This statistic shows the revenue of the LVMH Group worldwide from 2008 to 2025, by segment. In 2025, LVMH Group's global revenue saw a considerable increase across the board. The company's revenue totaled about 80 billion euros that year, with the fashion and leather goods segment accounting for the biggest share of total revenue."
Image 3 - Statista: LVMH Revenue by Segment (2008-2025, stacked horizontal bars) This chart breaks down LVMH's total yearly revenue into its five business segments (fashion & leather goods, selective retailing, wines & spirits, watches & jewelry, perfumes & cosmetics) going back to 2008. The fashion and leather goods segment -- the one that includes handbags -- visibly becomes the longest bar in the chart from the early 2010s onward, showing it grew into the company's largest revenue source over time. This is a good visual for demonstrating just how central handbags and leather goods have become to the world's largest luxury conglomerate's bottom line.
3. LVMH Investors & Analysts (Primary Company Financial Disclosure)
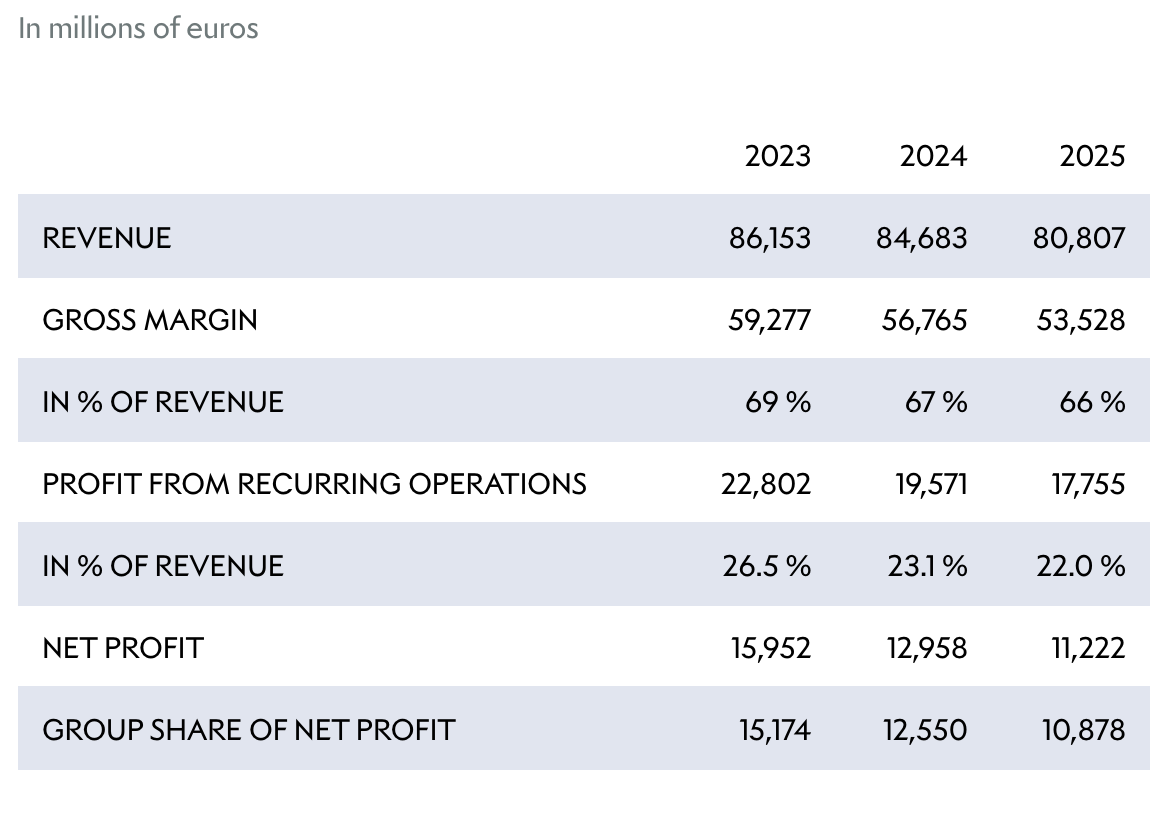
Official income statement figures (Revenue, Gross Margin, Profit from Recurring Operations, Net Profit), segment-by-segment revenue including Fashion & Leather Goods, links to full Annual Reports and Universal Registration Documents (PDFs).
Image 4a - LVMH Official Income Statement (2023-2025) This is a straightforward three-year financial summary -- total revenue, gross margin, operating profit, and net profit -- pulled directly from the company's own reporting. What stands out is the consistent year-over-year decline across every single line item from 2023 to 2025 (revenue down from about €86B to €81B, net profit down from about €16B to €11B). This is valuable as a reality check against optimistic market forecasts: it shows what a real company's numbers looked like during a period the market-research projections describe as steady growth.
4. StockX (Live Resale Marketplace Data)
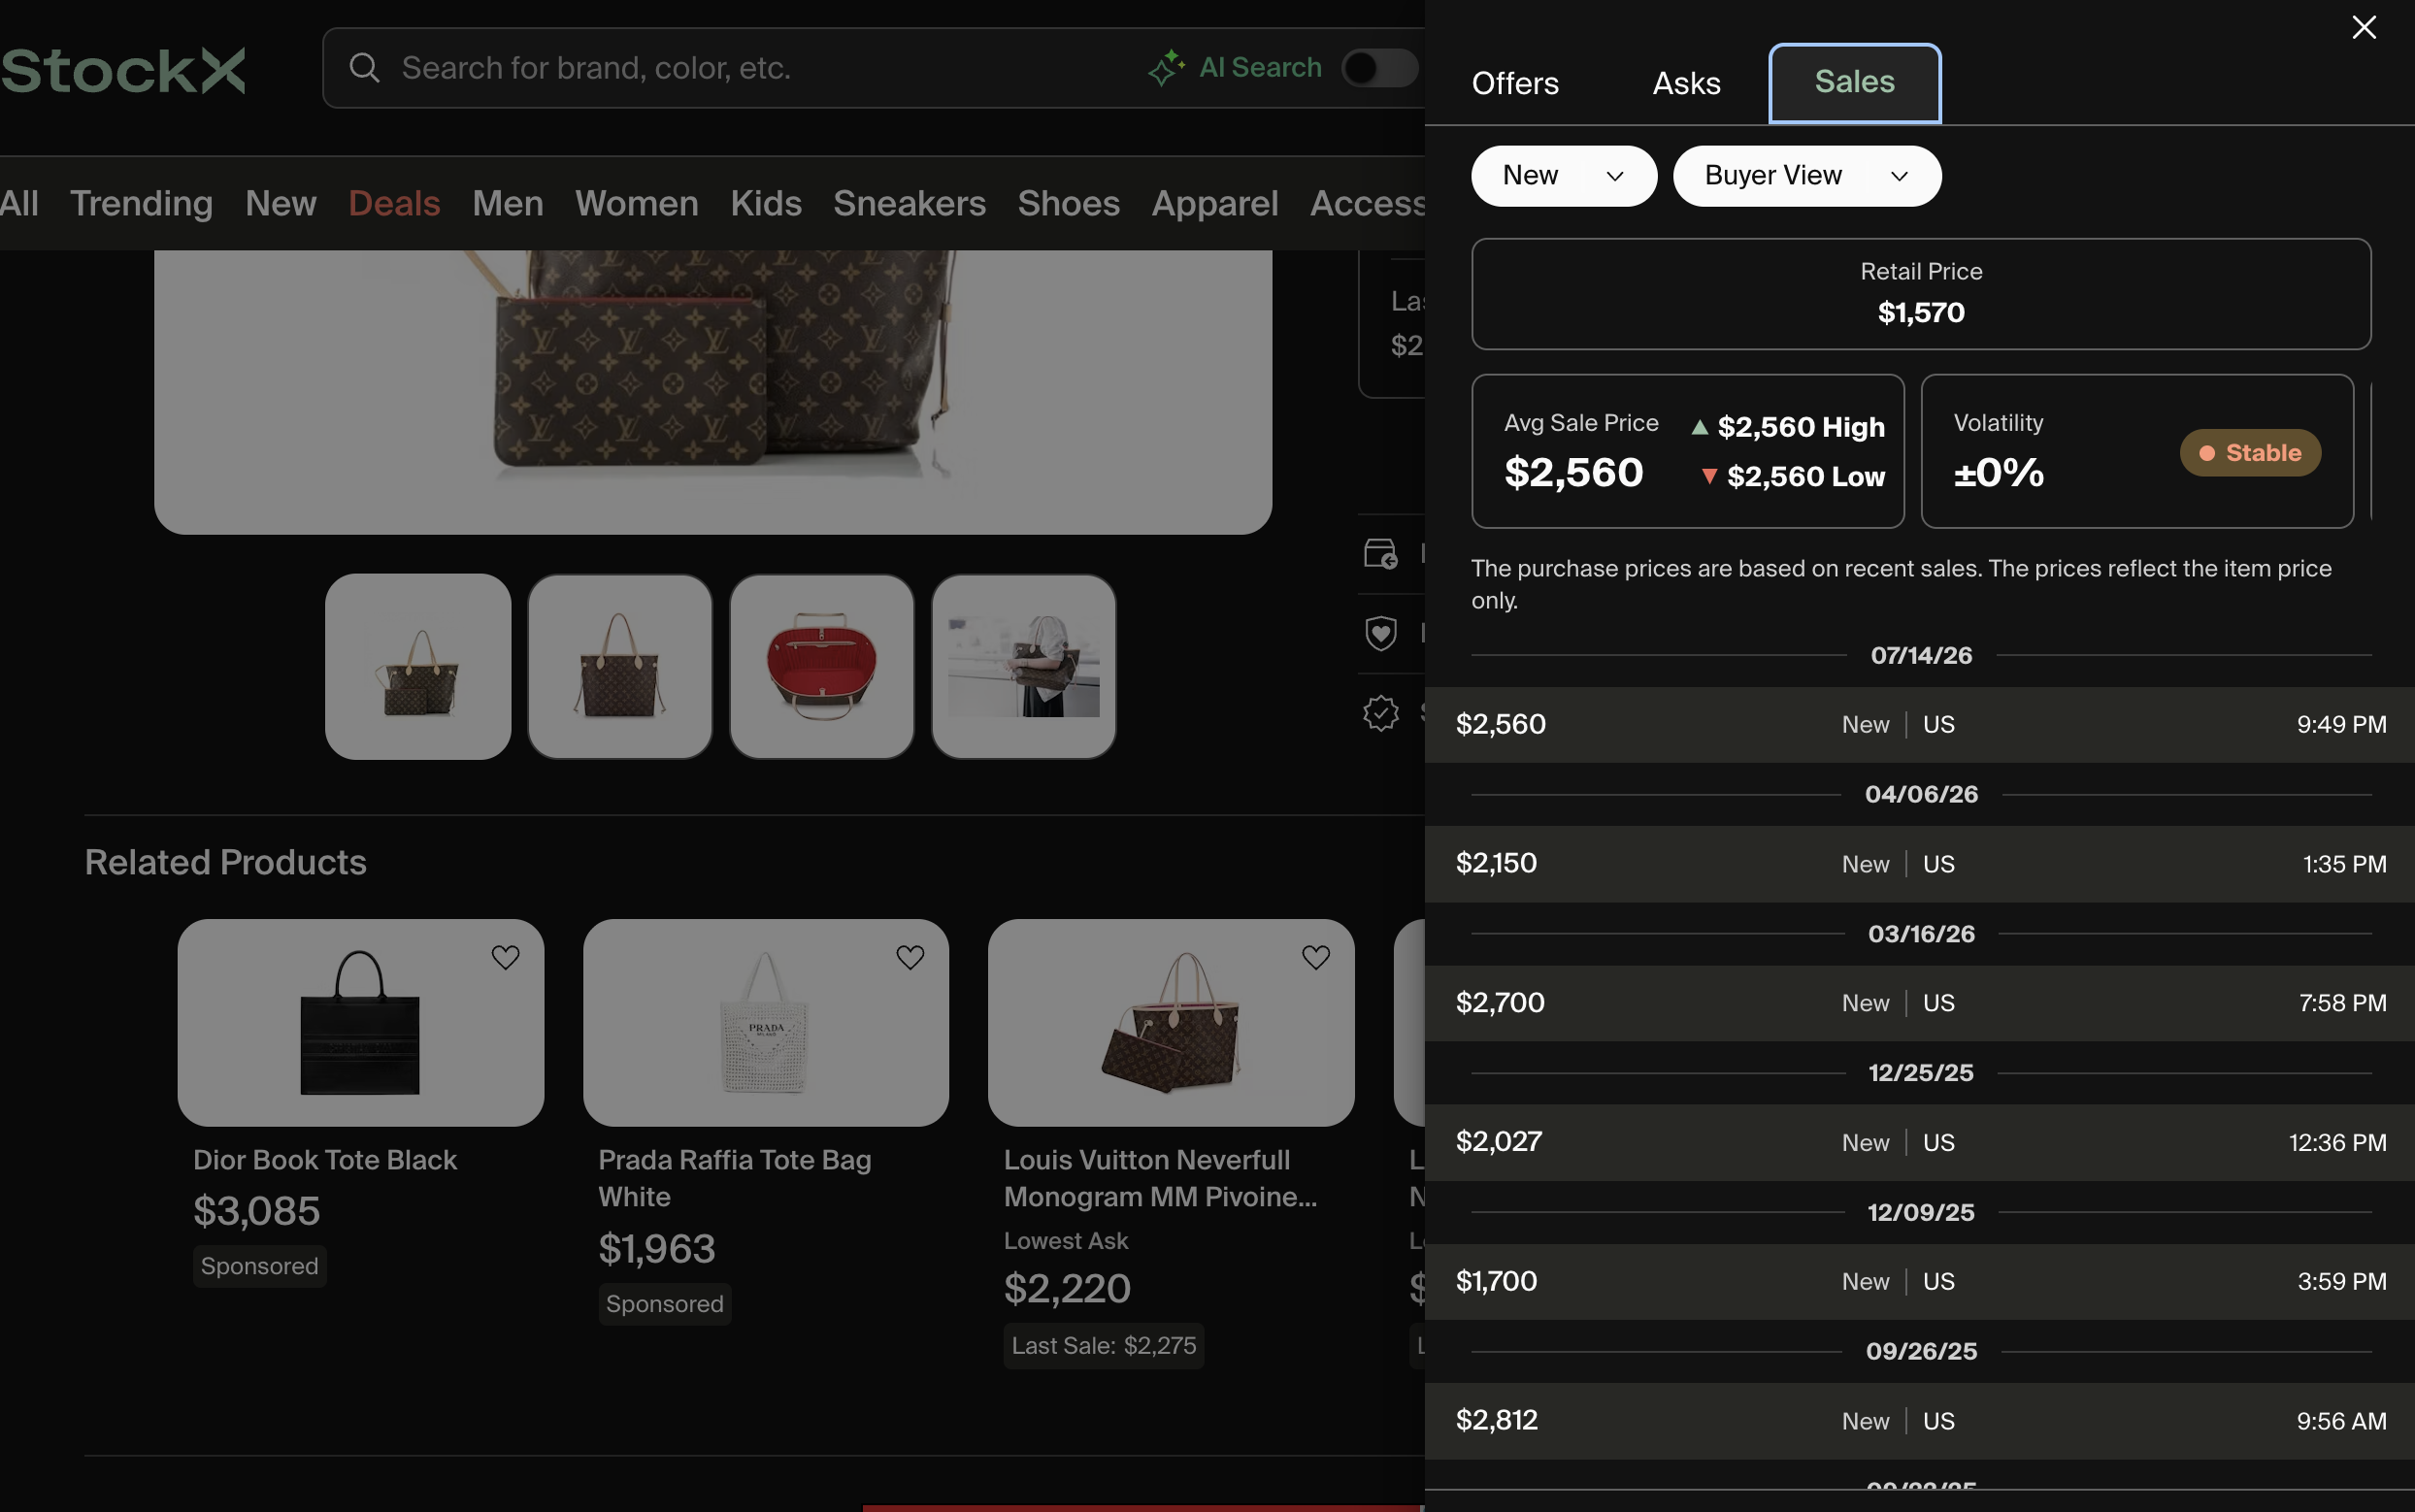
Live bid/ask pricing on individual handbags (Hermès, Chanel, Louis Vuitton, Goyard, etc.), each with "current market value," number of past sales, and % premium/loss vs. original retail price. It functions like a stock ticker for handbags.
Image 4b - StockX Handbag Listing (Louis Vuitton bag resale data) This is a live product page showing a specific handbag's original retail price alongside its actual resale sale history. Each transaction dated and priced, plus an average resale value and a "volatility" indicator. In this example the bag is reselling for well above its original retail price, which is a concrete, transaction-level illustration of the "handbags as investments" idea that shows up throughout the market-research narrative. It's the most literal form of raw data of the four sources since it reflects real completed sales rather than an estimate or survey.
Insights
Resale value functions as a primary-market pricing mechanism, rather than a secondary effect. The report states that secondary market platforms demonstrate that certain luxury handbag models retain or appreciate in value, and that this investment perception supports primary market pricing. This reframes the handbag as a hybrid product: part fashion good, part store of value. The practical implication is that a brand's resale performance (tracked on platforms like The RealReal or Vestiaire Collective) now functions almost like a stock price. This is a public signal that feeds back into full-retail demand. Hermès's Birkin and Kelly waitlists, reaffirmed in 2025 as per the report, are the clearest example of a brand actively managing scarcity to protect that signal.
Growth is concentrated in markets undergoing wealth transition, not markets with existing luxury infrastructure. China (8.4%) and India (7.8%) post the highest CAGRs, both explicitly tied to expanding middle-class populations, while Japan (4.7%) and the UK (5.3%), markets with the most mature luxury retail infrastructure, grow the slowest. This suggests the market's growth curve is now driven more by first-time luxury buyers entering the category than by repeat purchases from existing luxury consumers in saturated markets.
Competitive barriers in this market are structural and slow-moving, instead of being innovation-based. The report lists brand establishment, distribution development, production capability, and market access as the entry barriers, none of which are solvable through product R&D. This explains why the competitive benchmarking table shows heritage houses (LVMH, Chanel, Hermès) rated "High" or "Global" across nearly every category while newer entrants (Polene, Cult Gaia, Staud) are rated "Low" or "Niche" across the board. Decades of brand-building can't be shortcut, which is part of why M&A (e.g. LVMH's acquisition of Loewe) is a more common expansion path for larger players than organic brand-building.
Category demand is narrow rather than diversified. Tote bags (33.8% of product type), leather (72.5% of material type), and women's handbags (62.8% of end-user segment) each dominate their respective segmentation categories. This tells us the market's growth is coming largely from deeper penetration of established formats and materials rather than from experimentation. This is a contrast to categories like sneakers or streetwear, where novelty materials and silhouettes are frequent growth drivers.
What Consumers Should Consider
- Try: Compare FMI's forecast (28.9B → 52.81B by 2036, 6.2% CAGR) against LVMH's actual reported 2025 results (Fashion & Leather Goods down 5% organically). This helps with distinguishing between a forecast (FMI) and realized results (LVMH's own disclosures).
- Try: Cross-reference Statista's "most profitable handbag brands by resale ROI" statistic with live StockX listings for the same brands (Hermès, Louis Vuitton) to see whether the historical resale-premium data still holds up in current listings.
- Try: Use FMI's segmentation data (Leather 72.5% of material share, Totes 33.8% of product share) as the macro baseline, then check whether LVMH's own brand performance commentary (in their press release/annual report) singles out specific product lines as strong or weak performers.
- FMI's country CAGR table (China 8.4%, India 7.8%) will tell you where demand is expanding fastest; this is useful context before searching StockX or Statista for country-specific resale/retail pricing data, since demand growth in a market often front-runs price appreciation in that market.
Is the luxury handbag market actually growing, or just projected to grow?
Which brand should I consider if I want resale value retention?
Which material or bag type is the safest bet?
Where should I expect price growth or increased competition?
Useful research resources
-
 Future
Market Insights: Paid market-research firm (some data gated behind "Buy Now," but summary
stats, tables, and FAQs are free/visible on the page)
-
 Statista: Free-tier data aggregator / market-research clearinghouse
-
 Investors and
Analysts: Primary source as company self-reported, audited financial disclosure. This is the
most authoritative of the four but is filtered through the company's own framing (e.g. resilience
language even when revenue declines).
-
 StockX: Live
transactional marketplace data, the closest thing to "raw data" in this set, since it reflects
actual completed/pending transactions rather than survey or estimate data.